Home Assistant High CPU After an Update: Check Four Layers
A Home Assistant update tells you when the extra processor load appeared, not which part caused it. Treat the system as four layers: the physical or virtual computer, also called the host; Home Assistant Core, the main program; Supervisor, which manages Home Assistant OS and its apps; and the installed apps themselves. An integration—the software connection between Home Assistant and a device or service—runs inside Core, so an integration problem normally appears as high Core use rather than as its own separate CPU reading.
Start by comparing the layers. If one app is busy while Core is calm, restarting Core will not fix that app. If Core is busy but the load disappears in Safe mode, custom code is a stronger suspect. If all Home Assistant components look calm while the overall computer is busy, check work outside Core instead of deleting automations or buying faster hardware.
| What is high? | Likely layer | Best next check | Do not start with |
|---|---|---|---|
| One installed app | That app, such as a radio service, database, or other Home Assistant OS app | Open the app's log, then restart only that app if it is safe to interrupt | Restarting Core or restoring an older Core backup |
| Home Assistant Core | A built-in or custom integration, automation activity, database work, or another Core task | Read Core logs; use Safe mode for custom-code isolation | Rebooting the computer repeatedly |
| Supervisor | The service managing Home Assistant OS and its apps | Check Supervisor logs, updates, and Repairs | Disabling unrelated integrations |
| Overall computer, but listed components are low | The operating system, another container or virtual-machine workload, storage, or computer-level work | Use the computer or virtual-machine dashboard; check temperature and whether work is waiting on processor, memory, or storage | Replacing the Home Assistant database |
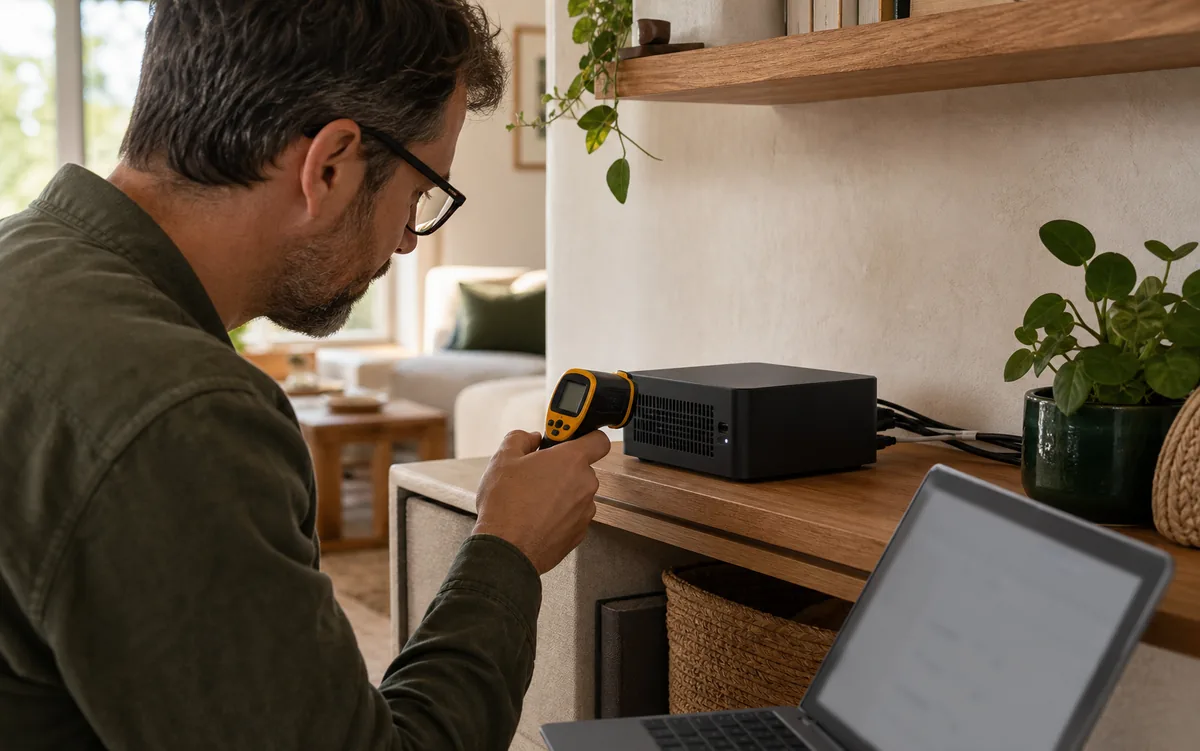
Temperature is evidence, not a diagnosis. A hotter case or faster fan supports the observation that the computer is working harder, but the acceptable temperature depends on the hardware, enclosure, airflow, and room. Keep vents clear and compare with the same machine's normal behavior.
1. Record the Versions and the Real Symptom
Write down the exact Home Assistant Core, Supervisor, operating-system, and app versions before another update changes the picture. In Home Assistant, open Settings → System → Repairs, use the three-dot menu, and select System information. Record whether the dashboard is actually slow, automations are delayed, the fan is louder, or the case is warmer.
Compare several readings during the same kind of household activity. A lone CPU snapshot is not a baseline, and a percentage from somebody else's Raspberry Pi, mini PC, virtual machine, or server is not a universal limit. What matters is a sustained change on your own computer together with a symptom or a clearly busy component.
If storage has filled up or recorder work is the obvious clue, use Tara's separate Home Assistant database and Recorder cleanup guide. Do not purge the database merely because CPU is high.
2. Find Which Home Assistant Component Is Busy
On Home Assistant OS, the built-in Home Assistant Supervisor integration provides CPU Percent entities for Home Assistant Core, Supervisor, and every installed app. An entity is simply a reading that Home Assistant can display and graph. These CPU entities are disabled by default. Open Settings → Devices & services, select the Home Assistant Supervisor integration, open its entities, and enable only the CPU readings you need for this comparison.
The official System Monitor integration can add processor use, processor temperature, memory, load, disk, and pressure readings that show whether work is waiting on the processor, memory, or storage. Its entities are also disabled by default. Add the integration from Settings → Devices & services, then enable the few diagnostic readings that answer this question. A temperature reading may not exist on a virtual machine or when the computer does not expose a compatible sensor.
For an optional command-line check on Home Assistant OS, ha core stats reports Core statistics. ha core logs shows Core logs; ha supervisor logs shows Supervisor logs. If you use Home Assistant Container—a self-managed installation that runs Core inside a software container—there is no Supervisor integration. Compare that container with the computer using the monitoring tools you already use to administer it.
3. Read the Log for the Busy Layer
For Core, open Settings → System → Logs. Look for the same integration name or error repeating near the times when CPU rises. The condensed System Log keeps recent errors and warnings, while the raw log contains the fuller record. A repeated message is a lead to verify, not permission to delete the named integration's data.
If an installed app has the high reading, open Settings → Apps, choose that app, and read its log. An app can consume processor time even when the main Home Assistant log looks quiet. Conversely, a quiet log does not prove a component is healthy; some expensive work completes without producing an error.
Before sharing a log or downloaded diagnostic file, read it. Home Assistant's diagnostics guidance requires integrations to remove sensitive fields, but location data, device names, addresses, account details, or other household information can still matter to you. Share only what the maintainer requests.
4. Restart Only the Smallest Busy Layer
If one Home Assistant OS app is clearly busy, restart that app from its page after checking that a short interruption is safe. If Core alone is busy, use Restart Home Assistant. That restarts Core; it does not restart Supervisor, installed apps, or the operating system.
Use Reboot system—or ha host reboot from the Home Assistant OS command line—only when the evidence points to the whole computer, several layers need a clean restart, or the smaller restart did not address a computer-level problem. Avoid pulling the power while the system is running because an abrupt loss can interrupt writes to storage.
After the chosen restart, repeat the same per-component comparison. If the load returns in the same component, you have a reproducible clue. If devices become unavailable after an otherwise normal restart, follow Tara's Home Assistant post-restart device checks instead of treating every unavailable device as a CPU problem.
5. Use Safe Mode Only When Core Is High
Home Assistant Safe mode loads Core without custom integrations, custom dashboard cards, or custom themes. From the UI, go to Settings → System → Restart Home Assistant and choose Restart Home Assistant in safe mode. The Home Assistant OS command-line equivalent is ha core restart --safe-mode.
If Core settles down in Safe mode, a custom integration or other excluded custom code becomes the first place to investigate. Re-enable normal mode, then test the strongest candidate based on recent updates and repeated log messages. Change one thing at a time so the result remains useful.
Safe mode is not a whole-system test. It does not stop installed Home Assistant OS apps, and it does not tell you which process on the computer is busy. If an app's own CPU sensor was high before Safe mode, diagnose that app directly.
6. Match the Exact Version Before You Roll Back
Check the full changelog for your release and every newer point release. As of July 26, 2026, the current Home Assistant Core 2026.7 point release is 2026.7.4. A narrowly matched issue may already have a fix, while a forum post about another version, installation type, or integration may lead you in the wrong direction.
A current case involving DSMR, an integration that reads compatible smart meters, shows why the details matter. The reported Core CPU increase began with Home Assistant 2026.6 and changed when the affected integration was disabled or Core ran in Safe mode. The DSMR parser correction appears in the 2026.7.2 changelog. That is evidence for checking the integration and exact versions—not evidence that every 2026.7 installation has a CPU defect.
Another recent homeowner found an installed OpenThread Border Router app carrying the load after a 2026.7.2 update, then saw normal behavior after restarting that app. That single household result is useful as an example of layer isolation, not proof of a universal OpenThread Border Router bug.
Back up before any rollback. Home Assistant OS documentation recommends restoring a partial backup to downgrade. Preserve the known-good backup until the system has run normally and your devices, automations, and history have been checked. Tara's safe Home Assistant update guide covers the backup and recovery plan.
When to Use the Home Assistant Profiler
Use the official Profiler integration only after the simple checks show that Core—not an app or the computer—is consuming the time and logs do not identify the work. Profiler can collect statistics showing how much time parts of Home Assistant take and can record current tasks, scheduled background work, running threads, and memory activity.
This is an advanced Core-side tool. It does not profile an installed app or an unrelated process on the computer. Capture the smallest useful profile and attach it only when an integration maintainer or issue template asks for one; profiling everything indefinitely creates noise rather than a clearer answer.
What to Avoid While Troubleshooting
- Do not downgrade from timing alone. Match the component, symptom, installation type, and version first.
- Do not disable integrations at random. Start with the component named by CPU readings, logs, Safe mode, or a matching issue.
- Do not delete the database. High processor use has several causes; confirm a Recorder or storage problem separately.
- Do not change DNS, networking, or radio settings because one discussion did. Those changes can create a second fault while leaving the first one unexplained.
- Do not replace the computer first. Faster hardware can hide an app or integration problem without fixing it.
- Do not post raw diagnostics blindly. Review household and account information before sharing.
Tara's Practical Recommendation
Keep three lightweight health readings available: overall processor use, Core CPU, and CPU for the few installed apps that matter most. Add processor temperature only when your hardware exposes it. A small history of your own normal system makes the next post-update change much easier to judge.
Label backups with the version and make the restart boundary explicit in the household instructions: app, Home Assistant Core, or whole computer. For a supported setup, Tara's configured Home Assistant system pairs the local computer with a documented update, monitoring, and recovery path.
FAQ
Why is Home Assistant CPU high after an update?
The load may be in Home Assistant Core, one installed app, a particular integration, Supervisor, or the computer running them. Compare those layers first. The fact that the change followed an update does not by itself prove a universal update bug.
Where can I see Home Assistant CPU usage?
On Home Assistant OS, enable the disabled-by-default CPU Percent readings supplied by the Home Assistant Supervisor integration for Core, Supervisor, and installed apps. System Monitor can provide processor-use and temperature readings, and ha core stats provides a Core command-line view.
Is Restart Home Assistant the same as rebooting its computer?
No. Restart Home Assistant restarts Core. Restarting an app affects that app, while Reboot system or ha host reboot restarts the entire Home Assistant OS computer.
Will Safe mode find every high-CPU cause?
No. Safe mode loads Core without custom integrations, custom cards, or custom themes. It is useful when Core is the busy layer, but installed apps and other work on the computer remain outside that test.
Should I downgrade Home Assistant when CPU rises after an update?
Only after you identify a matching version-specific issue and have a backup. Check the current point release first because the problem may already be fixed. On Home Assistant OS, the official downgrade path is a partial backup restore.